The following examples show images encoded/decoded using (with entropy coding )JPEG 2000 (The JASPER Project Home Page.) and (without entropy coding) REWIC with self-control.The images are decomposed by a 6-level 9-7 tap biorthogonal Daubechies filter.
In the coding community the peak signal to noise ratio (PSNR) is used often to precisely measure and quantify the error present in a compressed image and great effort is expended toward minimizing such an error. Any coding scheme which does not attempt to minimize some square-error cannot be expected to prove their worth with a curve of PSNR versus bit rate ([1]), which may be a constraint on the formulation of new coding schemes capable of making an intelligent use of the visual information. This may be justified assuming the correctness of the PSNR, but what are the actual properties of the PSNR? For example, does it take into account of the effectiveness of the information, so discriminating relevant structures from unwanted detail and noise? Does it examine whether the properties of the original image at significant points are equal to the properties of the decoded output at the corresponding locations? The point is that whereas we have no evident affirmative answer to these and other questions, the PSNR does not appear capable of predicting visual distinctness from digital imagery as perceived by human observers [2],[3],[4][5]
It often happens that the structure of a certain scene cannot be determined
exactly due to various reasons (e.g, it is possible that some of the details
may not be observable or the observer who makes an attempt to investigate
the structure may no take all the relevant factors governing the structure
into consideration). Under such circumstances, the structure of the reference
image and the input image can be characterized statistically by discrete
probability distributions. Let us assume the probabilities associated
with the reference ![]() and the input
and the input ![]() as those given by
as those given by ![]() and
and ![]() . Then, the problem of predicting recognition times for humans
performing visual search and detection tasks, can be reformulated as:
What is the amount of relative information gain between the probability
distributions
. Then, the problem of predicting recognition times for humans
performing visual search and detection tasks, can be reformulated as:
What is the amount of relative information gain between the probability
distributions ![]() and
and ![]() ?
?
A number of postulates were proposed in [2] to
characterize the information gain between two distributions with a minimal
number of properties which are natural and thus desirable. For example
a first postulate (Principle 1 [2] )
states a property of how unexpected a single event of a digital image
was. A second postulate (Principle 2
![]() ) was formulated to obtain a fair estimate of how unexpected a digital
image was from some probability distribution by means of the mathematical
expectation of how unexpected its single events were from this distribution.
The Principle 3 [2] relates the
estimate of how unexpected the reference image was from an ``estimated''
distribution and the estimate from the ``true'' distribution.
) was formulated to obtain a fair estimate of how unexpected a digital
image was from some probability distribution by means of the mathematical
expectation of how unexpected its single events were from this distribution.
The Principle 3 [2] relates the
estimate of how unexpected the reference image was from an ``estimated''
distribution and the estimate from the ``true'' distribution.
The human visual system does not process the image in a point-by-point manner but rather in a selective way according to the decisions made on a cognitive level, by choosing specific data on which to make judgments and weighting this data more heavily than the rest of the image, [6]. Hence, in order to devise measures that better capture the response of the human visual system, we should use a feature detection model for identifying significant locations at which to measure errors. This point is stated in Principle 4 [2].
We are interested in one approach in which the error between two images may be measured on locations of the reference picture at which humans might perceive some feature, for example, line features or step discontinuities. This point is stated in Principle 5 [2]. This postulate also presents the information conservation constraint: properties of the input image (e.g., first order local histograms) should be equal to the properties of the reference image at its significant locations.
The Principle 6 [2] states the significance conservation constraint, i.e. significance of interest points in the reference image is equal to the significance of the corresponding points in the input image. This constraint can help in qualitative comparison of the input image with the reference one.
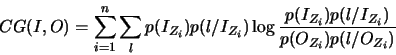
From results in [2], we have that
the compound gain (CG) between a test image ![]() and decoded outcome
and decoded outcome ![]() is a generalization of the Kullback-Leibler joint information gain
of various random variables such that, it satisfies Postulates 1
through 6 in [2]:
is a generalization of the Kullback-Leibler joint information gain
of various random variables such that, it satisfies Postulates 1
through 6 in [2]:
Given any coding scheme the CG may then be applied to quantify the
visual distinctness by means of the difference between the original image
![]() and decoded images at various bit rates. It allows us to analyze
the behavior of coders from the viewpoint of the visual distinctness
of their decoded outputs, taking into account that an optimal coder
in this sense tends to produce the lowest value of the CG. The software
and documentation of the compound gain may be accessed here.
and decoded images at various bit rates. It allows us to analyze
the behavior of coders from the viewpoint of the visual distinctness
of their decoded outputs, taking into account that an optimal coder
in this sense tends to produce the lowest value of the CG. The software
and documentation of the compound gain may be accessed here.
A first experiment was designed to analyze the comparative performance of the PSNR and the CG for predicting visual (subjective) quality of reconstructed images using several compression methods.
To this aim, a test image was firstly compressed
to the same bit rates using the state of the art in progressive transmission SPIHT [7]
(without entropy coding), the state of the art coder JPEG2000 [9], and REWIC with self-control
(without entropy coding). This figure shows the respective
reconstructed test images at 0.5, 0.25, and 0.125 bits per pixel (bpp).
Fifteen volunteers, nonexperts in image compression, subjectively evaluated the reconstructed images using an ITU-R Recommendation [10]. The ITU-R 500-10 recommends to classify the test pictures into five different quality groups:
|
SUBJECTIVE
QUALITY FACTOR
|
|
|
5
|
EXCELENT, The distortions are imperceptible |
|
4
|
GOOD, The distortions are perceptible |
|
3
|
FAIR, The distortions are slightly annoying |
|
2
|
POOR, The distortions are annoying |
|
1
|
BAD, The distortions are very annoying |
The method of assessment was cyclic in that the assessor was first presented with the original picture, then with the same picture but decoded at a bitrate. Following this she/he was asked to vote on the second one, keeping the original in mind. The assessor was presented with a series of pictures at different bitrates in random order to be assessed. At the end of the series of sessions, the mean score for each decoded picture was calculated. The next table summarizes the mean quality factors for different decoded outputs using the compression methods.
|
||||||||||||||||||||
|

|
| 2D plots on rate-distortion
as given by the PSNR and the CG for REWIC with self-control, JPEG2000
and SPIHT at 0.5, 0.25, and 0.125 bpp. |
|
As can be seen from these figures, the PSNR
predicts that the SPIHT results in a higher image fidelity than both JPEG2000 and REWIC with self-control, which does not appear to
correlate with subjective quality estimated by human observers (see table ). On the contrary, the overall impression is
that, as predicted by the compound gain, the REWIC with self-control results
in a higher image fidelity than SPIHT
and JPEG2000 (recall that an optimal coder in this sense tends to
produce the lowest value of the CG ),
which correlates with subjective fidelity by humans. Also, the CG predicts a better visual fidelity
using JPEG2000 than with the SPIHT reconstructed images, which correlates with the subjective
image quality in table.
In this second experiment, a new test image was also compressed to the same bit rates using SPIHT (without entropy coding), JPEG2000, and REWIC with self-control (without entropy coding). This figure shows the reconstructed test images at 0.5, 0.25, and 0.125 bpp. Again fifteen volunteers subjectively evaluated the reconstructed images as described above. The next summarizes the mean quality factors.
|
||||||||||||||||||||
|
|
| 2D plots on rate-distortion as
given by the PSNR and the CG for REWIC with self-control, JPEG2000
and SPIHT at 0.5, 0.25, and 0.125 bpp. |
|
Up you can see 2D plots on rate-distortion as given by the PSNR and the CG for REWIC with self-control, JPEG2000 and SPIHT at 0.5, 0.25, and 0.125 bpp. For example, the PSNR predicts that both JPEG2000 and SPIHT result in a higher image fidelity than REWIC with self-control, which does not appear to correlate with subjective quality estimated by human observers (see table ). On the contrary, as can be seen from the figure, the compound gain predicts that REWIC with self-control results in a higher image fidelity than SPIHT and JPEG2000, which correlates with subjective fidelity by humans given in the table. Summarizing, it seems that whereas the PSNR gives a poor measure of image quality, the CG is a good predictor of visual fidelity for humans performing subjective comparisons.
![]()
Given a test image ![]() , let
, let
![]() be the set of decoded images at bitrates
be the set of decoded images at bitrates
![]() using SPIHT;
using SPIHT;
![]() be the set of decoded images at bitrates
be the set of decoded images at bitrates
![]() using REWIC with self-control. The compound gain
using REWIC with self-control. The compound gain ![]() may then be applied to quantify the visual distinctness by means
of the difference between the original image
may then be applied to quantify the visual distinctness by means
of the difference between the original image ![]() and decoded images at various bit rates
and decoded images at various bit rates ![]() :
:
Once distortion functions ![]() have been calculated following equation (2), we make use of an objective
criterion for coder selection based on the overall difference between
the two functions
have been calculated following equation (2), we make use of an objective
criterion for coder selection based on the overall difference between
the two functions ![]() and
and ![]() , which can be measured by a Kolmogorov-Smirnov (K-S) test to a certain
required level of significance.
, which can be measured by a Kolmogorov-Smirnov (K-S) test to a certain
required level of significance.
Definition: Coder Selection Procedure. In the language of
statistical hypothesis testing, the coding scheme ![]() with self-control is significantly better than
with self-control is significantly better than ![]() for the test image
for the test image ![]() if the following two conditions are true:
if the following two conditions are true:
Condition 1 takes into account that an optimal coder tends to produce
the lowest value of ![]() across bit rates, and disproving the null hypothesis in condition 2
in effect proves data sets
across bit rates, and disproving the null hypothesis in condition 2
in effect proves data sets
![]() and
and ![]() are from different distributions. If both conditions hold, it allows
us to assess the fact that, for the test image,
are from different distributions. If both conditions hold, it allows
us to assess the fact that, for the test image,
![]() is significantly better than
is significantly better than
![]() .
.
|
||||||||||||||||||||||||||||
The last table summarizes the results of this experiment on the test images of the dataset : Thirty-nine out of forty-nine test images (79 %) have passed conditions (1) and (2) in the coder selection procedure, and hence, the REWIC with self-control is significantly better than SPIHT with high confidence level for seventy-nine percent of test images.
REWIC with self-control results from the integration of a rational embedded
wavelet codec (called REWIC in [11]) with the cooperative
action for bit allocation--called COllective Rationality for the ALlocation
of bits [12] (CORAL). Hence, the REWIC with
self-control should improve the performance of REWIC with a fixed risk attitude
in order to achieve the performance levels of the CORAL scheme while still maintaining
the embedded property. To analyze this point, we test in this fourth experiment
the comparative performance of REWIC
[11] with risk aversion
parameter ![]() set to
set to ![]() , REWIC with self-control and CORAL [12] against
SPIHT
[7]. Results were obtained without entropy-coding the
bits put out with the coding schemes.
, REWIC with self-control and CORAL [12] against
SPIHT
[7]. Results were obtained without entropy-coding the
bits put out with the coding schemes.
To this aim we employ again the coder selection procedure as described
above. The next table illustrates the three comparative performances
on the dataset of 49 test
images. As can be seen from this table: (i) REWIC with risk aversion
parameter ![]() set to
set to ![]() is significantly better than SPIHT
with high confidence level for sixty-one percent of test images; (2)CORAL is significantly better
than SPIHT
with high confidence level for seventy-four percent of test images; and
(3) as we know from the previous experiment, REWIC with self-control is
significantly better than SPIHT
with high confidence level for seventy-nine percent of images.
is significantly better than SPIHT
with high confidence level for sixty-one percent of test images; (2)CORAL is significantly better
than SPIHT
with high confidence level for seventy-four percent of test images; and
(3) as we know from the previous experiment, REWIC with self-control is
significantly better than SPIHT
with high confidence level for seventy-nine percent of images.
|
||||||||||
We also compare the performance in rate-distortion sense of the REWIC with
risk aversion parameter set to 0, REWIC with self-control, and CORAL, where the distortion is
the compound gain .
To illustrate more clearly the results of the comparison, for the dataset of 49 images,
in this figure shows the
respective 2D plots on rate-distortion as given by the CG for the three coding schemes.
The compression ratio ranges from 128:1 to 16:1.
|
||||||||
This comparison can be also given from a different point of view just comparing SPIHT/REWIC against JPEG2000. The results are given in the next table: SPIHT is better than JPEG2000 for zero percent of images, whereas REWIC with self-control is better than JPEG2000 for fourteen percent of images.
|
||||||||
This figure illustrates the performance in a rate-CG sense of the JPEG2000 , SPIHT, and REWIC with self-control on the dataset of 49 test images .
![]()